← Back to Work
DATA ANALYTICS · JMP
Bike Sharing Demand & User Behavior Analysis
A behavioral and operational analysis of daily and hourly bike-sharing data from 2011–2012, with emphasis on registered versus casual users, time patterns, weather and seasonality.
PROJECT OVERVIEW
What the project covers
A behavioral and operational analysis of daily and hourly bike-sharing data from 2011–2012, with emphasis on registered versus casual users, time patterns, weather and seasonality.
The dataset is used as an educational analytics case study.
JMPEDAData ValidationData VisualizationBehavioral AnalysisBusiness Interpretation
APPROACH
What I did
- Prepared daily and hourly datasets and joined calendar attributes for richer temporal analysis.
- Validated consistency between the aggregated hourly data and the daily totals.
- Compared casual and registered users by hour, working day, holiday, season and weather conditions.
- Translated descriptive patterns into operational and marketing interpretations.
KEY FINDINGS
What came out of the analysis
- Registered-user demand peaks around commuting periods, especially near 08:00 and 17:00–18:00.
- Casual-user activity is more concentrated from roughly 12:00 to 17:00, with stronger presence on holidays.
- The 14:00–17:00 period was identified as a useful conversion window for casual users, while 12:00–13:00 and 16:00–18:00 provide strong overlap for campaigns.
- Season and weather materially affect demand, with winter showing lower usage and summer stronger activity.
FULL REPORT
Analysis report
21-page report. Report language: Persian.
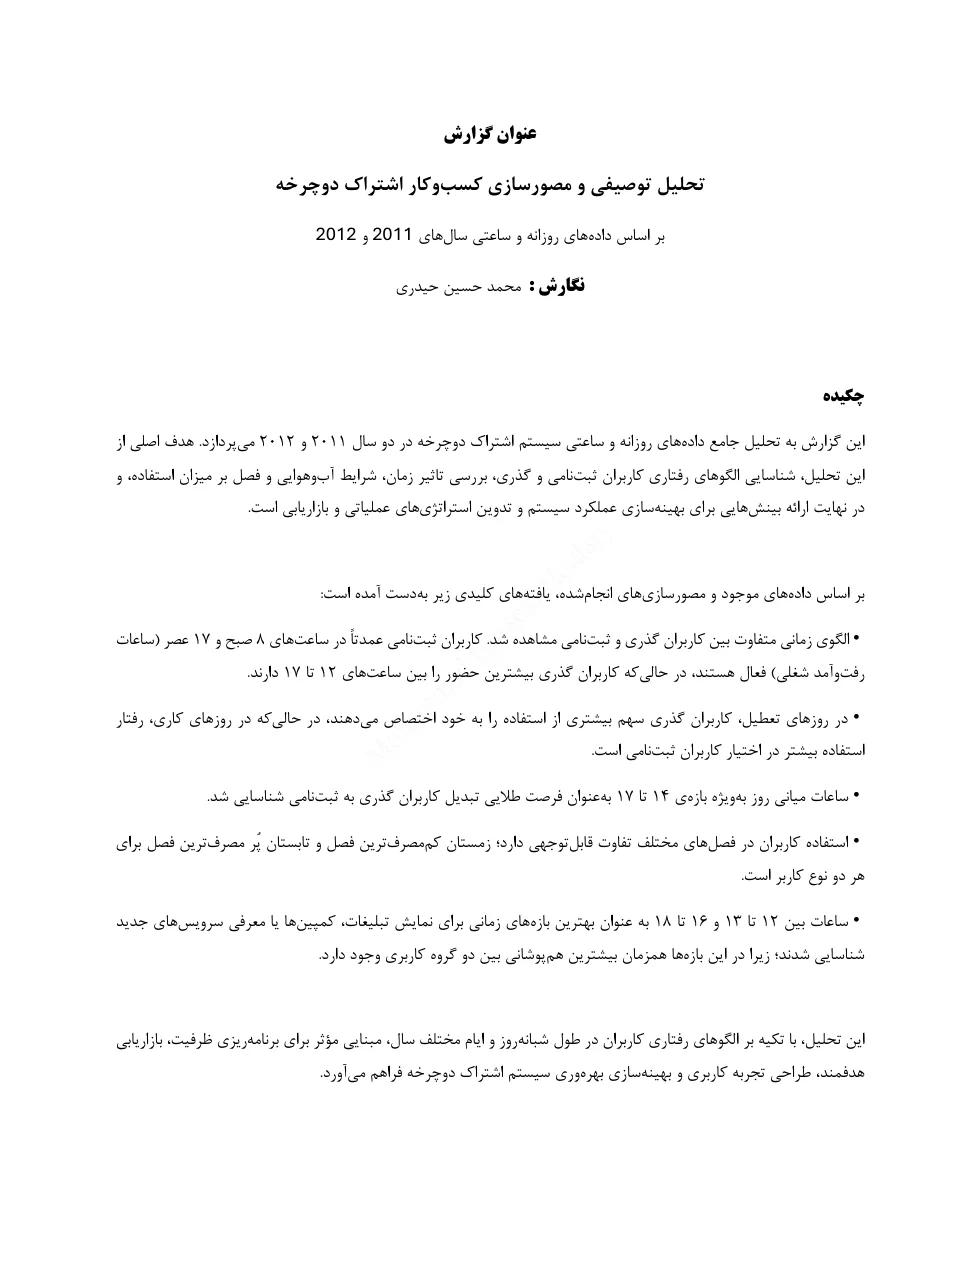
Bike Sharing Demand & User Behavior Analysis21 pages · PDF · Persian
MORE WORK
Explore the rest of the portfolio.
Return to the selected-work page for other analytics, web and systems projects.